Peptide COA Purity vs. Assay and Net Peptide Content
Read HPLC area percentage, calibrated assay and peptide mass per vial using their different units and reporting bases.
HPLC area percentage describes the share of included detector signal assigned to a peak. A peptide assay measures a defined amount, such as milligrams of peptide per vial or milligrams per gram of material. Check the method, analyte and denominator before comparing the results.
Find the denominator behind the percentage
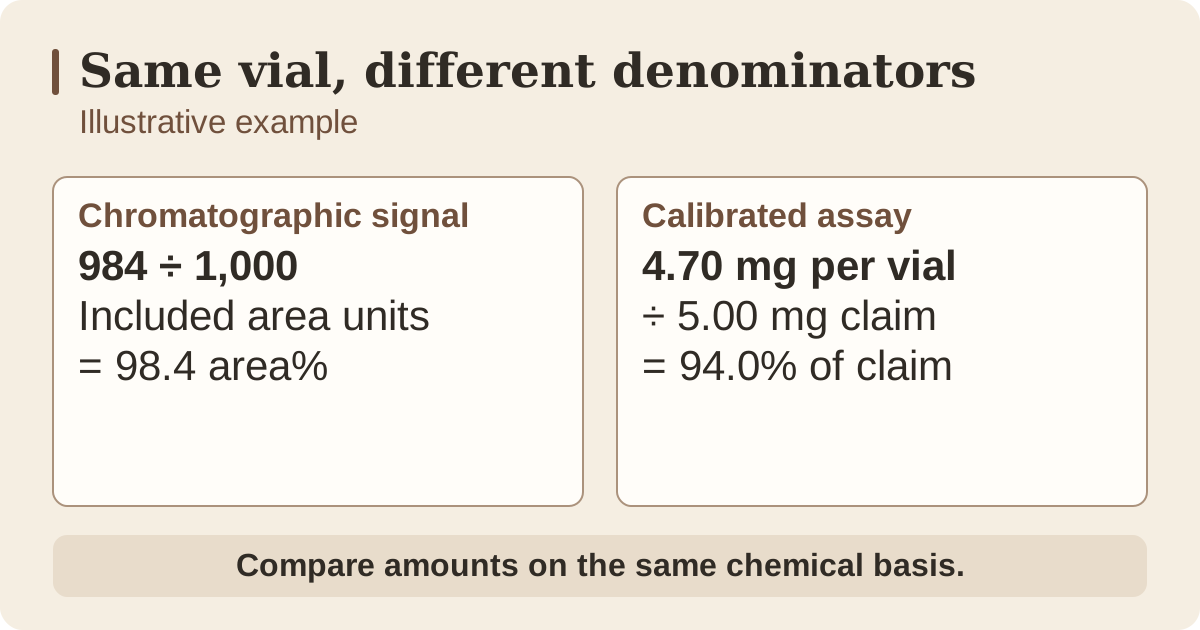
On a peptide certificate, “purity by HPLC” often refers to a chromatographic area calculation. If the main peak has area 984 and the included peaks sum to 1,000 in the same signal units, the result is 98.4 area%. A peak’s area reflects the detector response under the stated method. The reporting rules determine which signals enter the total. A co-eluting impurity can contribute signal within the main peak, and components with a weak response at the selected wavelength can contribute little area relative to their mass.
Look for the exact term the certificate uses. Some procedures estimate individual impurities using calibration or relative response factors. “98.4 area%” and “98.4% by mass” name different measured quantities. A chromatographic area result also gives no measurement of water or counterions by itself.
McCarthy et al. (2023), Reference Standards to Support Quality of Synthetic Peptide Therapeutics · EMA, Synthetic peptides guideline, §§ 2, 4.1, 4.3 and 4.4
Read assay or content on its stated basis
A quantitative assay uses a procedure calibrated or otherwise characterized for the quantity it reports. A common chromatographic approach measures the sample against a reference material whose peptide content has been assigned. The report may state mg/vial, mg/g, percent by mass or percent of a specified claim. Look for the chemical form on which the result is based, such as the peptide moiety or the named salt, and whether a bulk result is reported as received or on an anhydrous basis.
McCarthy and colleagues illustrate two separate measurements in a reference-standard study. They characterized a bulk peptide using results for peptide-related impurities, counterions, water and other contributions. They used the assigned content of that bulk material as the basis for a chromatographic assay of finished vials. Their study illustrates why an amount in a vial and the relative signal in one chromatogram are distinct report fields.
McCarthy et al. (2023), Reference Standards to Support Quality of Synthetic Peptide Therapeutics · EMA, Synthetic peptides guideline, §§ 2, 4.1, 4.3 and 4.4 · ICH Q2(R2), Validation of Analytical Procedures, corrected April 2025
Reconcile a fictional three-line certificate
Imagine a 5.00 mg stated peptide amount, a 98.4 area% HPLC result and a calibrated assay of 4.70 mg peptide per vial. If the declared amount and assay use the same chemical form and vial basis, the assay is 94.0% of the stated amount (4.70 ÷ 5.00 × 100). The 98.4 area% still describes the included chromatographic signal. If the certificate instead shows only 98.4 area% and the label says 5.00 mg, the amount field in your worksheet remains unreported.
A similar check applies when the certificate gives “assay 96%.” Ask whether the percentage means percent of label claim, a mass fraction on an as-received basis, or a value corrected for water or another component. For example, if the method and quantities are defined consistently, a fictional as-received mass fraction of 90.0% with 5.0% water by mass corresponds to 94.7% on a water-free basis (90.0 ÷ 95.0 × 100). A salt-basis correction is a separate calculation and requires information about counterion content or composition.
For a document comparison, write each reported value beside the attribute, analytical procedure, units, chemical form and denominator. Include the sample ID or lot with every entry. That preserves the difference between an issuer’s numerical result and any derived percentage you calculate later.
| Report field | Analyte or signal | Procedure | Measurement basis | Result and unit | What you can record |
|---|---|---|---|---|---|
| Chromatographic purity | Main peak assigned to the target peptide | RP-HPLC/UV at 214 nm | 984 divided by 1,000 included signal-area units | 98.4 area % | Relative integrated detector signal under the stated conditions. |
| Quantitative assay | Target peptide on a peptide-moiety basis | HPLC/UV assay against a reference with assigned content | Peptide mass per individual tested vial | 4.70 mg peptide equivalent per vial | Separately measured target-peptide amount. It is 94.0% of a 5.00 mg claim on the same basis. |
| “Net peptide content” | Unspecified in this line | Unreported | Unreported | 96% (percentage basis unspecified) | Ask which peptide quantity, method and denominator the issuer used. Confirm whether the material was measured as received or on a corrected basis. |
For the first line, see how the choice of included peaks and the detector response affect the result in the worked HPLC integration example.
McCarthy et al. (2023), Reference Standards to Support Quality of Synthetic Peptide Therapeutics